IoT IoT
.png)
Connecting things and businesses digitally
One-stop solution for 6 key elements of IoT
IoT system is a system that is formed by collecting data from objects, analyzing big data, and visualizing it all together.
In other words, all of the following elements are essential to the technological domain:
edge devices as data collection sources, cloud environments for storing big data,
machine learning and AI for processing and analyzing stored data,
IoT application and visualization development for converting processed data into service value,
and connecting these elements together.
The IoT is a technological domain in which all of these elements are essential.
AsiaQuest provides one-stop development solutions for these six key elements of IoT,
and supports tailor-made implementation of IoT from all possible approaches.
6 key elements of an IoT solution IoTソリューションの主要6要素

Optimal selection, installation, configuration and development of smart devices, beacons, sensors and gateway terminals required to recognize, process and acquire GPS and image data

Establishment of an environment for storing, managing, and analyzing big data acquired from edge devices and optimization of data processing

Design and develop functionality to visualize data processed in the cloud on edge devices and management consoles and convert it into service value

UI design and interface design and development that elevates application visualization into a more intuitive and easy-to-use service

Design and develop machine learning and AI processing that efficiently and autonomously processes data on edge devices and in the cloud, enabling predictive scores and real-time validation

Design and development of connectivity functions necessary to establish IoT systems, such as API connections that link data communication between edge devices, applications, and the cloud
AsiaQuest's
IoT One-Stop Solution
アジアクエストの
IoTワンストップ・ソリューション

IoT Solution Case Studies IoTソリューション事例紹介
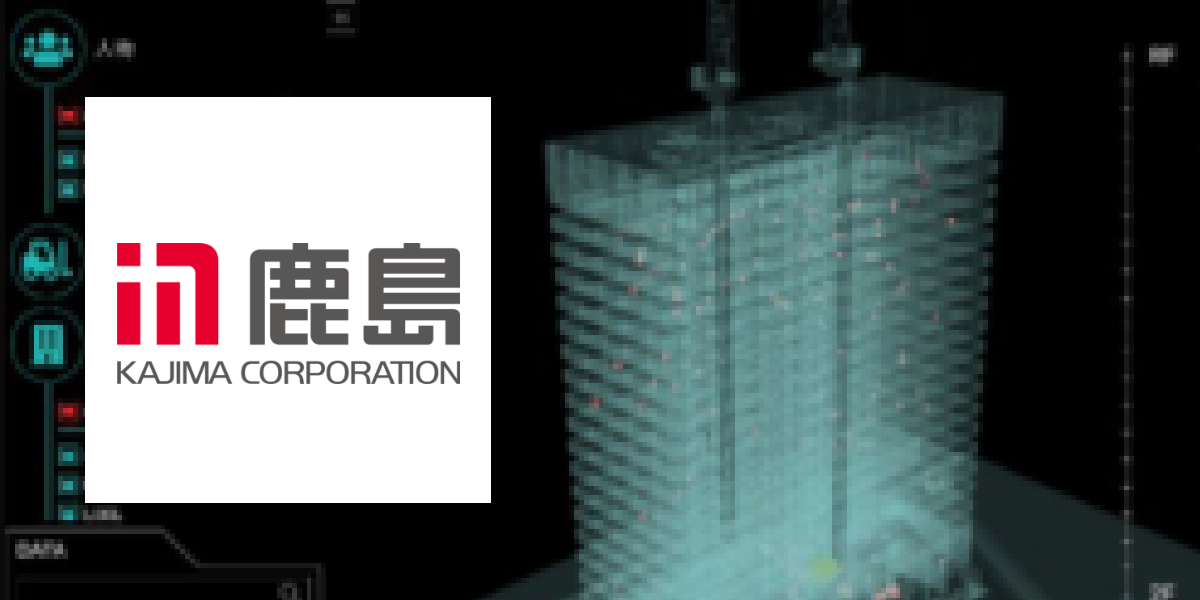
KAJIMA CORPORATION
Developed "3D K-Field," a real-time site management system that displays the position and operational status of materials and equipment at construction sites, as well as the position and vital information of people, in real time and in three dimensions.
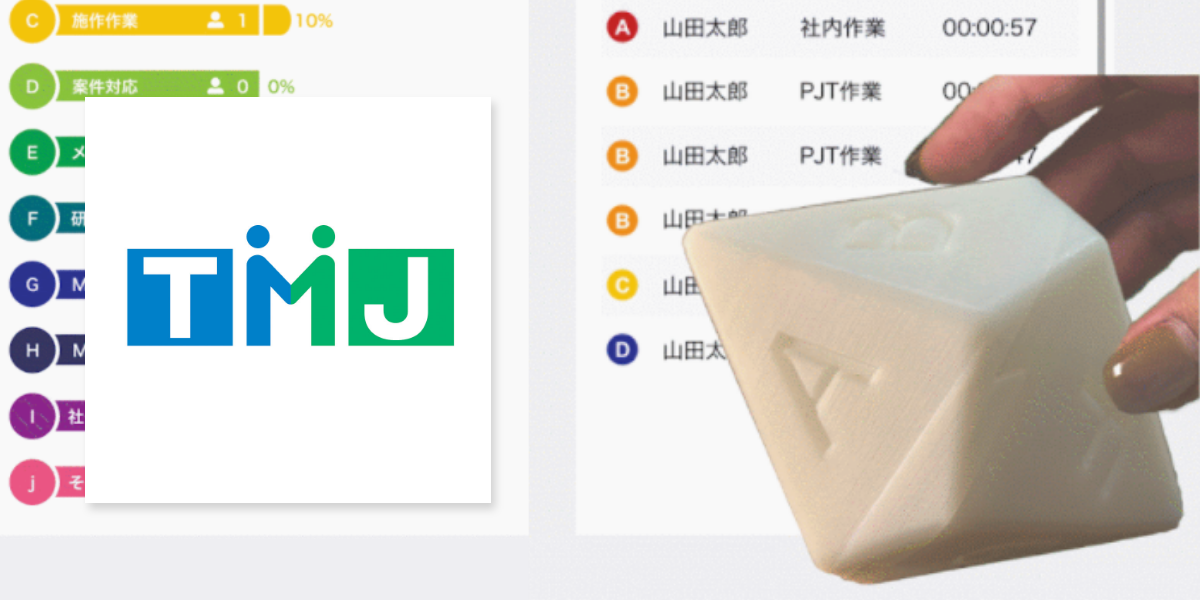
TMJ, Inc.
Introduced "Smart CUBE", a dice-shaped IoT device developed for the purpose of understanding operator uptime and accurately visualizing work content

ITOCHU Techno-Solutions Corporation
Gateway devices were placed at each business location to enable time and attendance management from the logs of small beacons held by all employees. Reduction of time and attendance input omissions and reduction of time and attendance management man-hours through linkage with existing time and attendance system
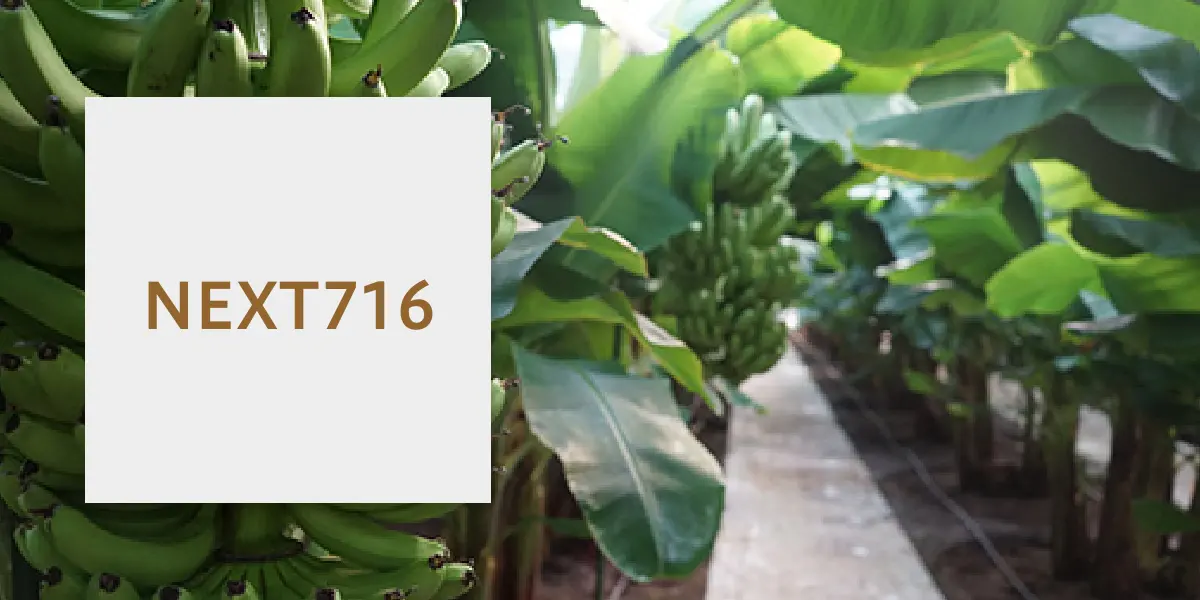
Banana Farm
IoT devices have been installed in greenhouses to understand the environment suitable for banana cultivation, which is rarely seen in Japan. Temperature, humidity, and CO2 data are shared in real time with on-site managers and workers in charge.
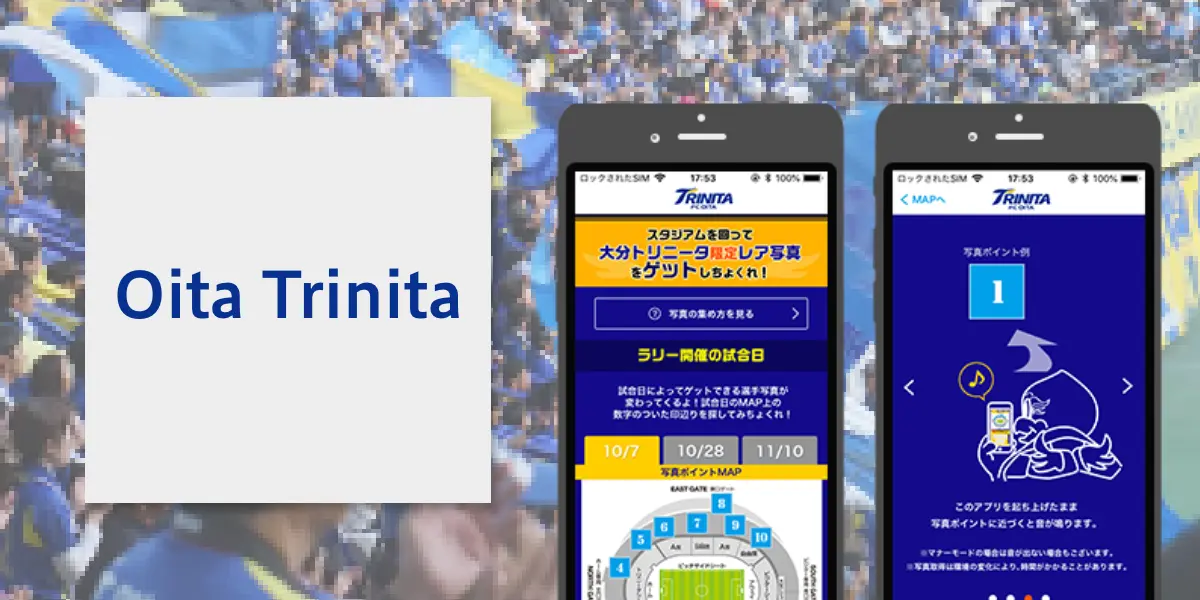
Oita Trinita
Implemented measures to increase spectator satisfaction at the stadium. Developed a stamp rally application using beacons and smartphones, as well as an AI system that uses image analysis to determine the level of congestion at concession stands.
NTT DoCoMo, Inc.
Provides "XR City™", a smartphone application developed jointly with Startia Labs Inc. for NTT DOCOMO, INC.'s "XR City™ SHINJUKU" Phase 2 project.